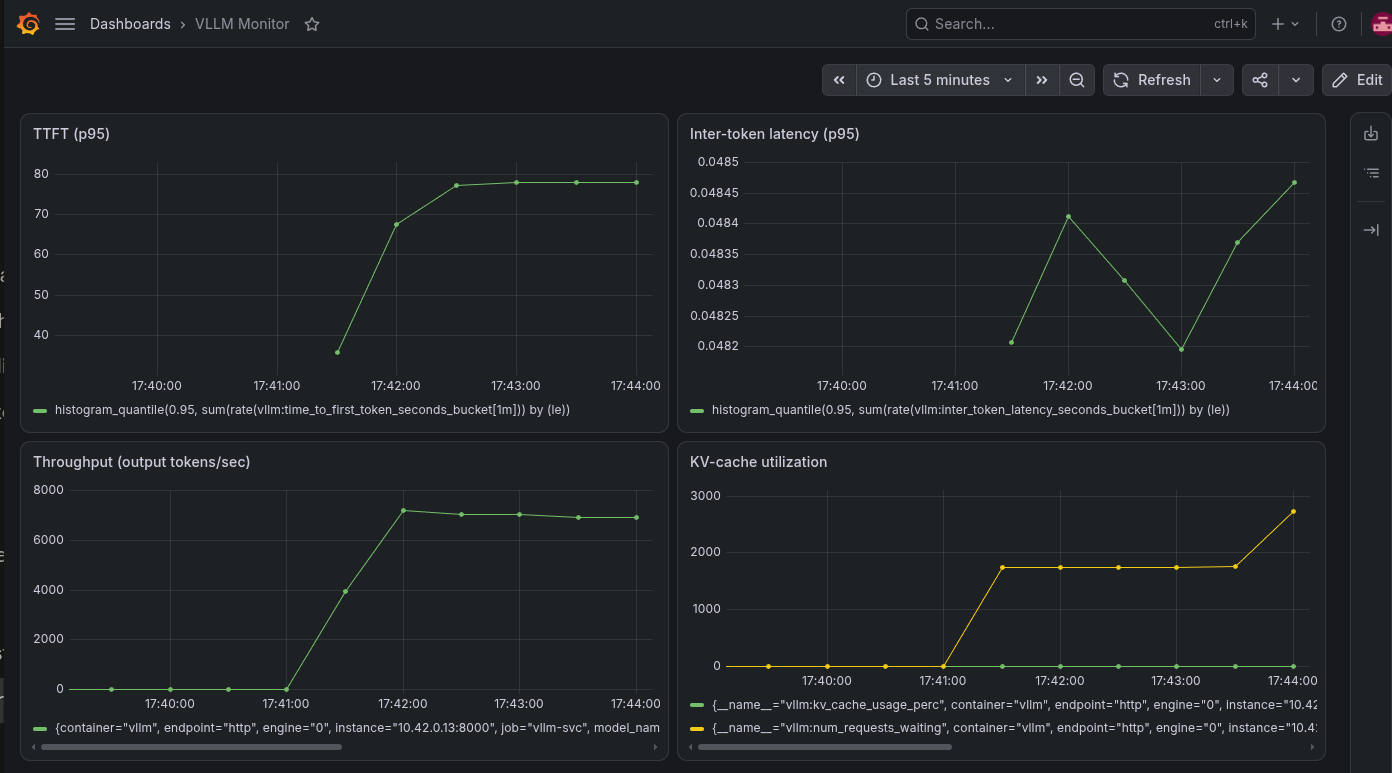
Basic LLM Monitoring with Grafana and Prometheus
Note, this post assumes you have a basic understanding of containerization and kubernetes works. I highly suggest skimming my introduction to k3s first.
Repo for this project lives here: llm-serving-vllm-k8s
In this blog post, I walk through how to setup Prometheus for monitoring the pods we set up in my previous post. Additionally, we walk through setting up monitoring for the local vLLM instance using Grafana.
Some Context#
Prometheus is the thing that we used to monitor vLLM. It works on a pull-based model, which means that it periodically queries some endpoint (in this case /metrics using a GET request) on each target, and stores the numbers it scrapes. This means that “deploying” Prometheus involves the following:
- Run Prometheus
- Tell it which endpoints to scrape. This one hides a subtle challenge, in Kubernetes each pod has a dynamic IP which changes on every restart, meaning we can’t hardcode the IPs which we want to scrape.
The way to do this within our yaml file is by describing a Prometheus operator and a Service Monitor.
Before I go further, it’s important to understand a few things:
Deployment#
This is I want to run, in this case it’s my vLLM pod but can be any workload and is of kind: Deployment. This owns the lifecylce of my vLLM process: it pulls the image, starts the cnotainer within a pod, restarts it if it crashes, maintains the correct number of replicas. This is the object which does the reconcile loop; if I kill a pod, the Deployment notices it and makes a new one.
Service#
This makes my deployment reachable at a stable addres. The pod’s IP changes on every restart, so the service sits in from with a fixed address and routes traffic to whichever pod is currently alive. This has no lifecyle on its own, it’s a routing rule. The selector label here means “send traffic to any pod with these labels”.
ServiceMonitor#
of kind: ServiceMonitor which are the instructions to Prometheus, which tells Prometheus to “scrap this Service’s /metrics, here, this often”. Prometheus reads the ServiceMonitor and acts on it. The ServiceMonitor is a small config object which points Prometheus to my endpoint.
A question I had in the beginning: Why isn’t the deployment and the service one object? The issue the
Serviceis solving is that theDeployment'spods are unstable in identity. When one goes down, another spins back up with a different IP and a new a name. If anything tried to interact with the pod directly, it would break on every restart, so theServicesits in front with a fixed IP and tracks which pod IPs are alive, updating the list as the Deployment churns pods. The link between theDeploymentand theServiceare its labels; TheDeploymentlabels: {app: vllm}matches theselector: {app: vllm}in theService.
This goes with the entire philosophy of splitting compute, networking and observability across three objects, each doing exactly one job.
Step I - Install Prometheus with Helm#
Helm is a Kubernetes package manager (think apt or dnf in the Linux land). A Helm “chart” is a bundle of manifests.
We are installing the kub-prometheus-stack which contains the Prometheus operator (the management engine), a Prometheus instance (the worker), Grafana and some exporeters:
# install helm if you don't have it
curl -fsSL https://raw.githubusercontent.com/helm/helm/main/scripts/get-helm-3 | bash

helm repo add prometheus-community https://prometheus-community.github.io/helm-charts
helm repo update
helm install kps prometheus-community/kube-prometheus-stack -n monitoring --create-namespace
kps is the release name, which should be remembered for Step 3, while -n monitoring --create-namespace puts everything in its own logical partition, so it’s isolated from the vLLM workload.
Once you apply the new configuration, you would see the new pods come up:
 ❯ kubectl get pods -n monitoring -w
NAME                                                    READY   STATUS    RESTARTS         AGE
alertmanager-kps-kube-prometheus-stack-alertmanager-0   2/2     Running   26 (5h35m ago)   8d
kps-grafana-5687cdb45d-jfbpz                            3/3     Running   39 (5h35m ago)   8d
kps-kube-prometheus-stack-operator-655d9c9ffd-6lqbs     1/1     Running   13 (5h35m ago)   8d
kps-kube-state-metrics-67c8fc75bb-2r2pk                 1/1     Running   13 (5h35m ago)   8d
kps-prometheus-node-exporter-4sqrg                      1/1     Running   13 (5h35m ago)   8d
prometheus-kps-kube-prometheus-stack-prometheus-0       2/2     Running   26 (5h35m ago)   8d
Step II - Make vLLM’s Service Selectable#
A ServiceMonitor selects Services by their labels. My vllm-svc Service neesd a label to match on:
apiVersion: v1
kind: Service
metadata:
  name: vllm-svc
  labels: {app: vllm}
spec:
  selector: {app: vllm}
  ports:
  - {port: 8000, targetPort: 8000, name: http}
Re-apply it (kubectl apply -f vllm.yaml). Nothing else about vLLM changes, its /metrics is already served on port 8000 (same port as the API), so the Service already exposes it; you’re only adding a label and confirming the port has a name.
Step III - create the ServiceMonitor#
There’s three lines here to pay attention to:
release: kps- the operator’s Prometheus wouldn’t adobt everyServiceMonitor, only the ones whose labels match the configured seletor. If you miss this, theServiceMonitoris valid, but does not throw any error and is completely ignored. If your target is missing, check thisselector.matchLabels: app: vllm- this connects to theServiceI labeled in Step 2namespaceSelector- because myServiceMonitorlives in themonitoringnamespace but the vLLM service lives indefault, you have to explicitly allow cross-namespace sleection.
apiVersion: monitoring.coreos.com/v1
kind: ServiceMonitor
metadata:
  name: vllm
  namespace: monitoring
  labels:
    release: kps
spec:
  selector:
    matchLabels:
      app: vllm
  namespaceSelector:
    matchNames: ["default"]
  endpoints:
  - port: http
    path: /metrics
    interval: 5s
Step IV - Verify that it works#
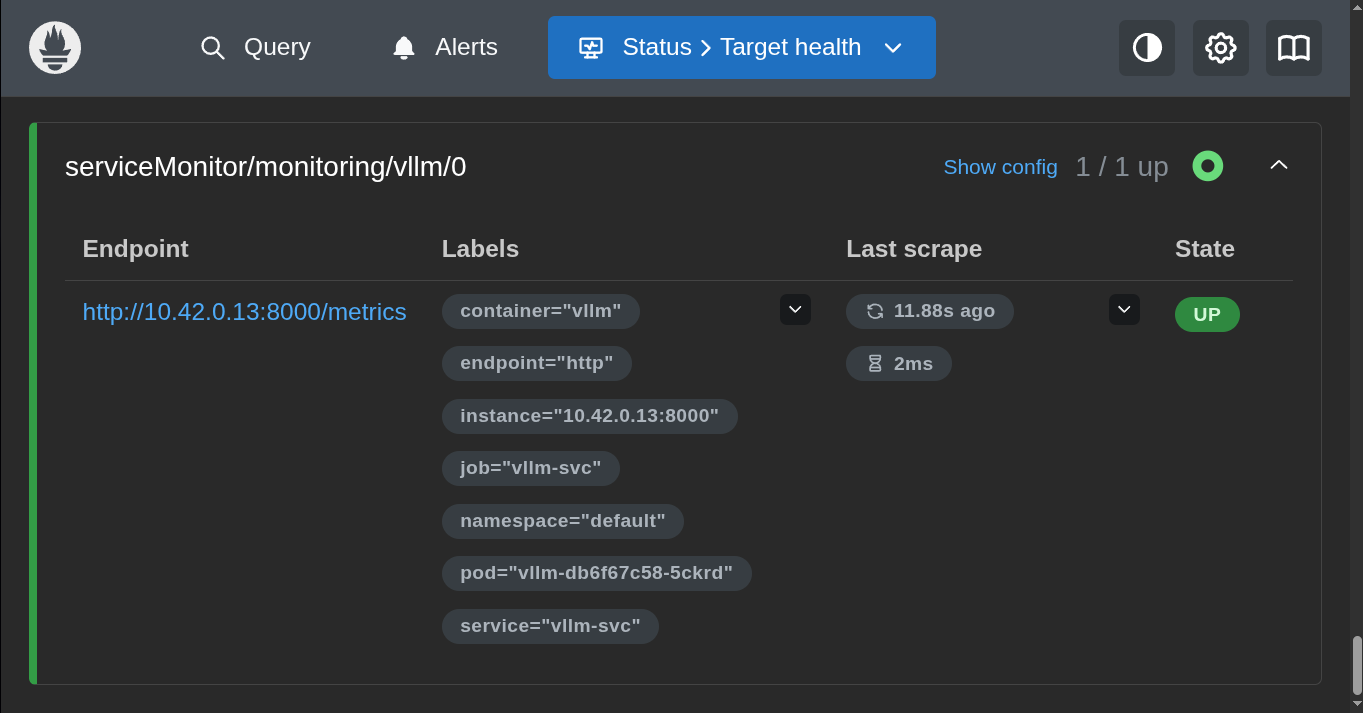
Port forward the /targets endpoint:
kubectl -n monitoring port-forward svc/kps-kube-prometheus-stack-prometheus 9090
and then open a web browser to your localhost:9090 address. You should see the vLLM endpoint with the state “UP” under /targets:
Setting up Grafana#
That section title is a bit misleading, since when we installed the helm chart we got Grafana bundled with prometheus. What we need to now do is port-forward to make the Grafana interface accessible from our local web-browser:
kubectl -n monitoring port-forward svc/kps-grafana 3001:80
I’m using port 3001 since the default 3000 was in-use by openwebui, OOPS.
Here we can create a dashboard by going: Dashboards -> New -> New dashboard -> Add Visualization -> select Prometheus datasource. For each panel below: add visualization and add queries that are useful for whatever you’re monitoring.
In my case I’m creating the following
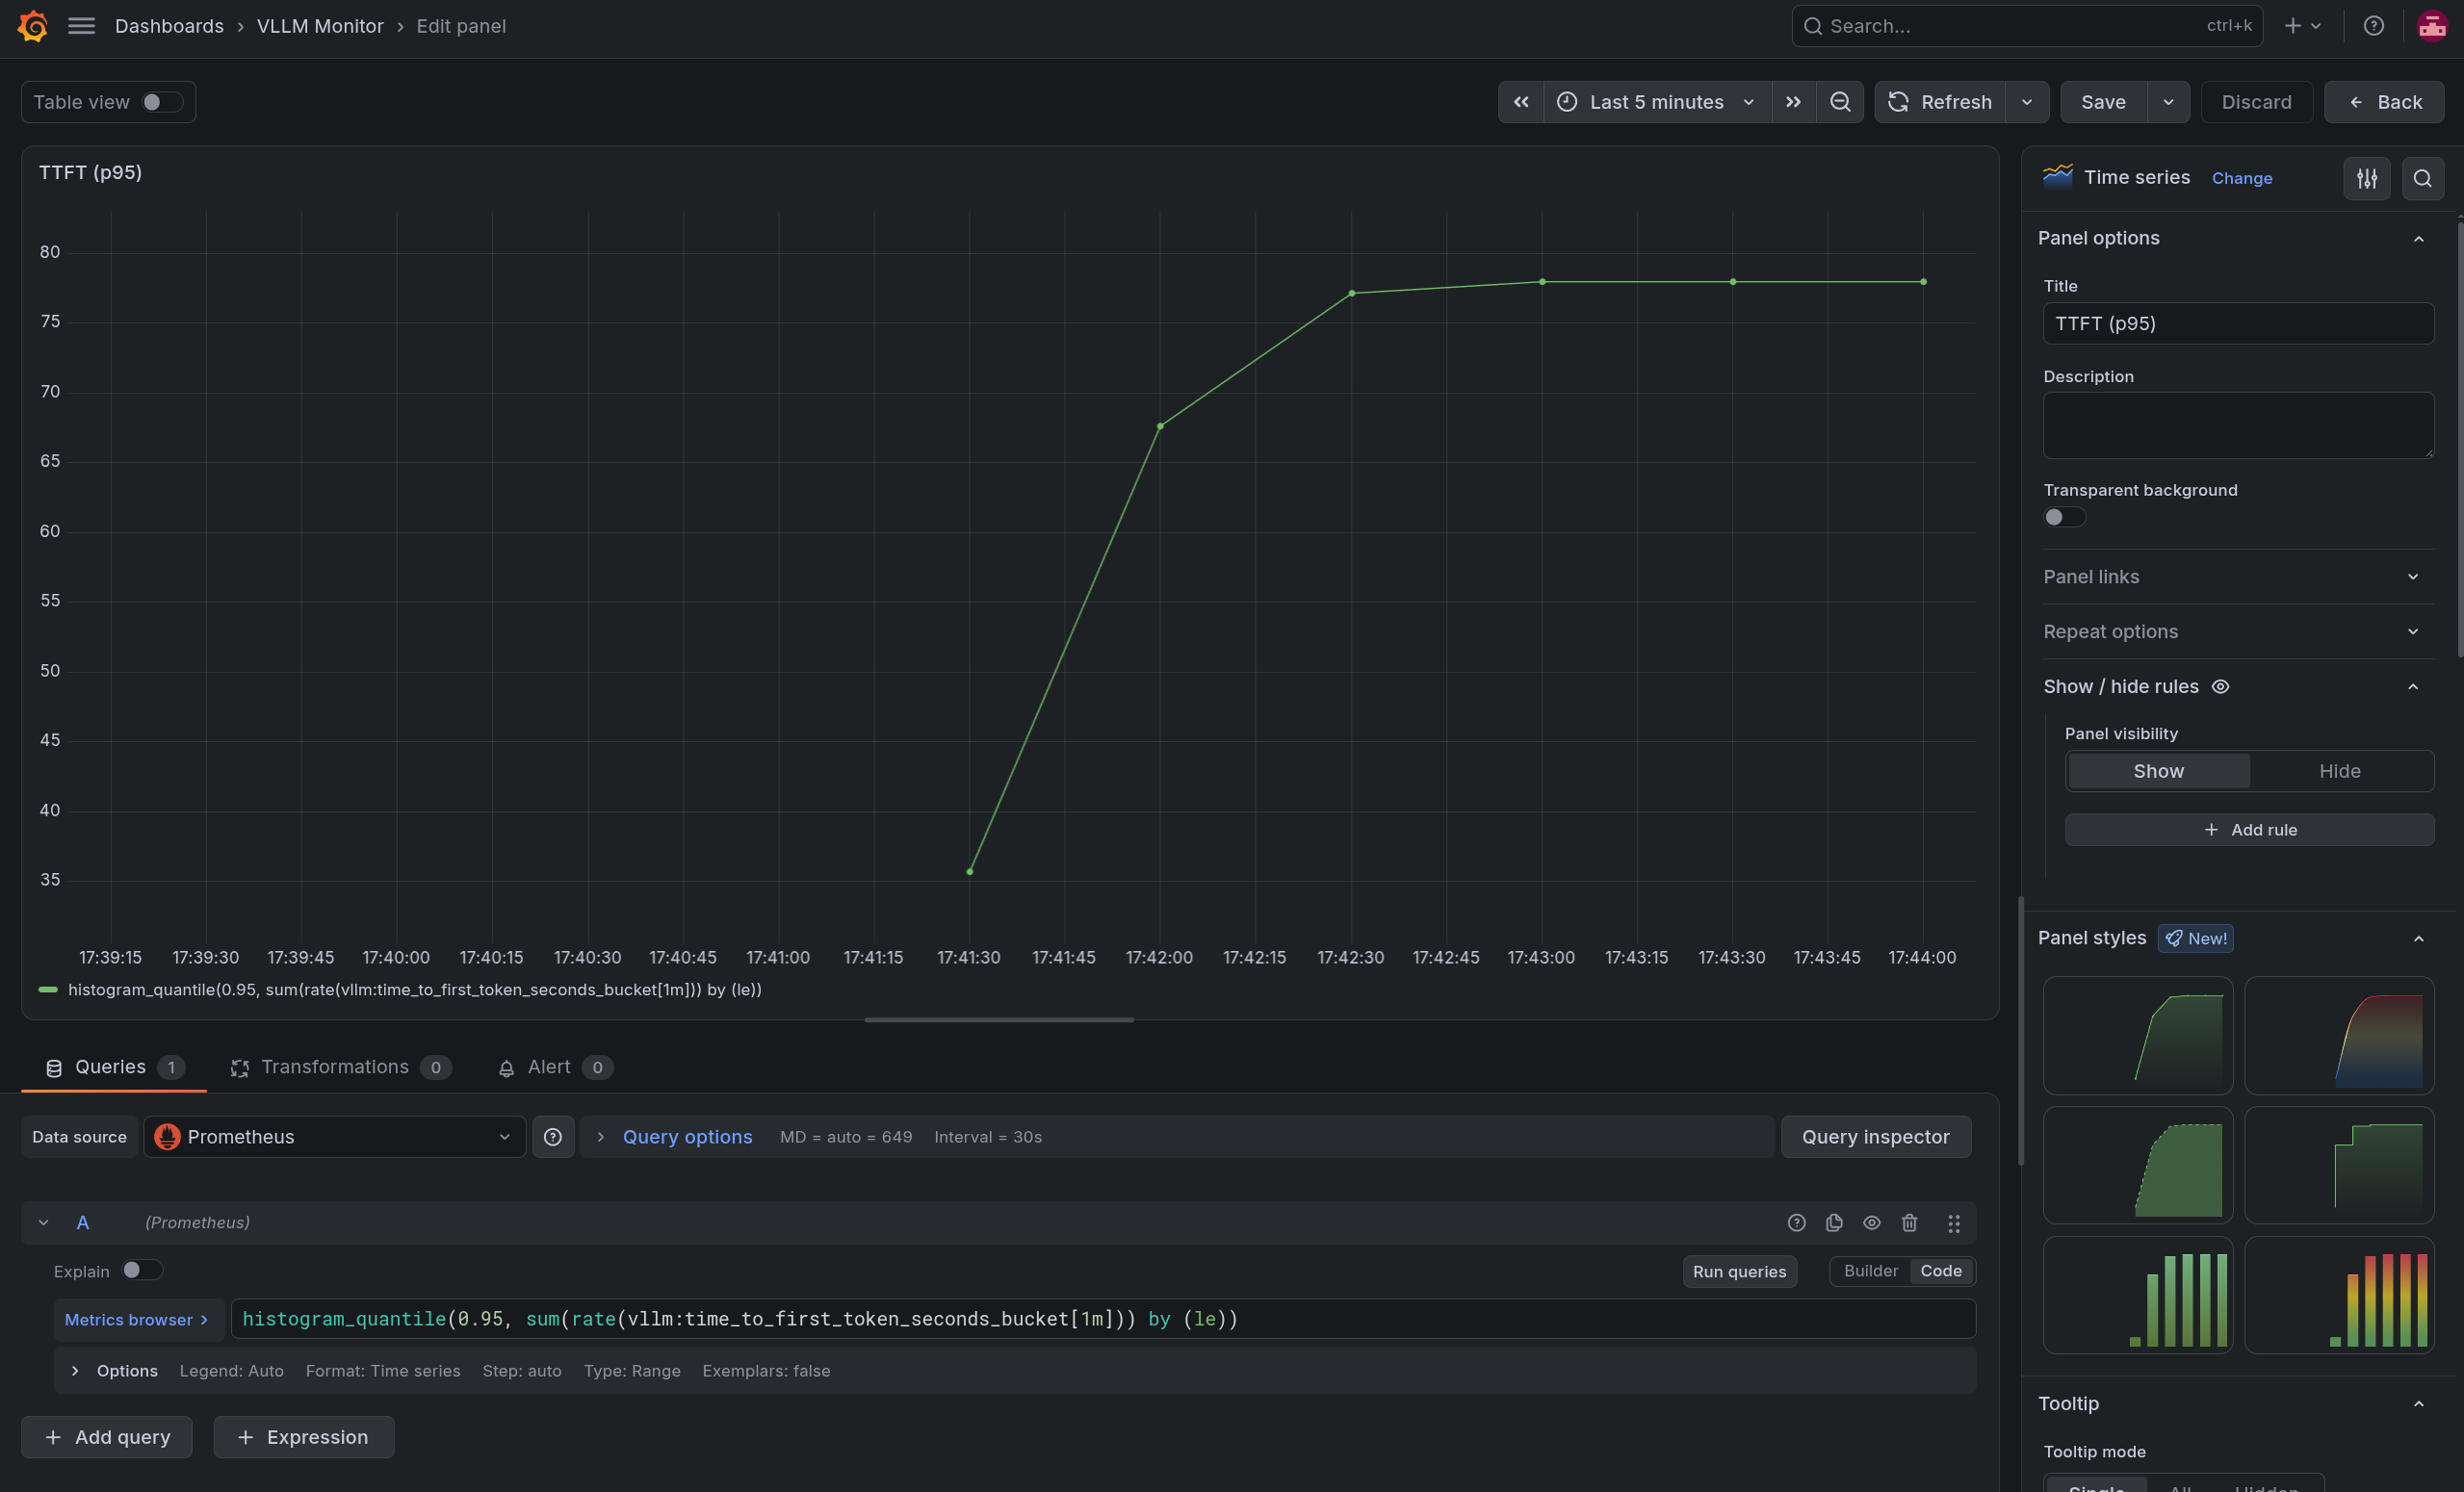
TTFT (p95)#
This is how long before the user sees anything. The number that makes a chat feel fast or broken.
histogram_quantile(0.95, sum(rate(vllm:time_to_first_token_seconds_bucket[1m])) by (le))
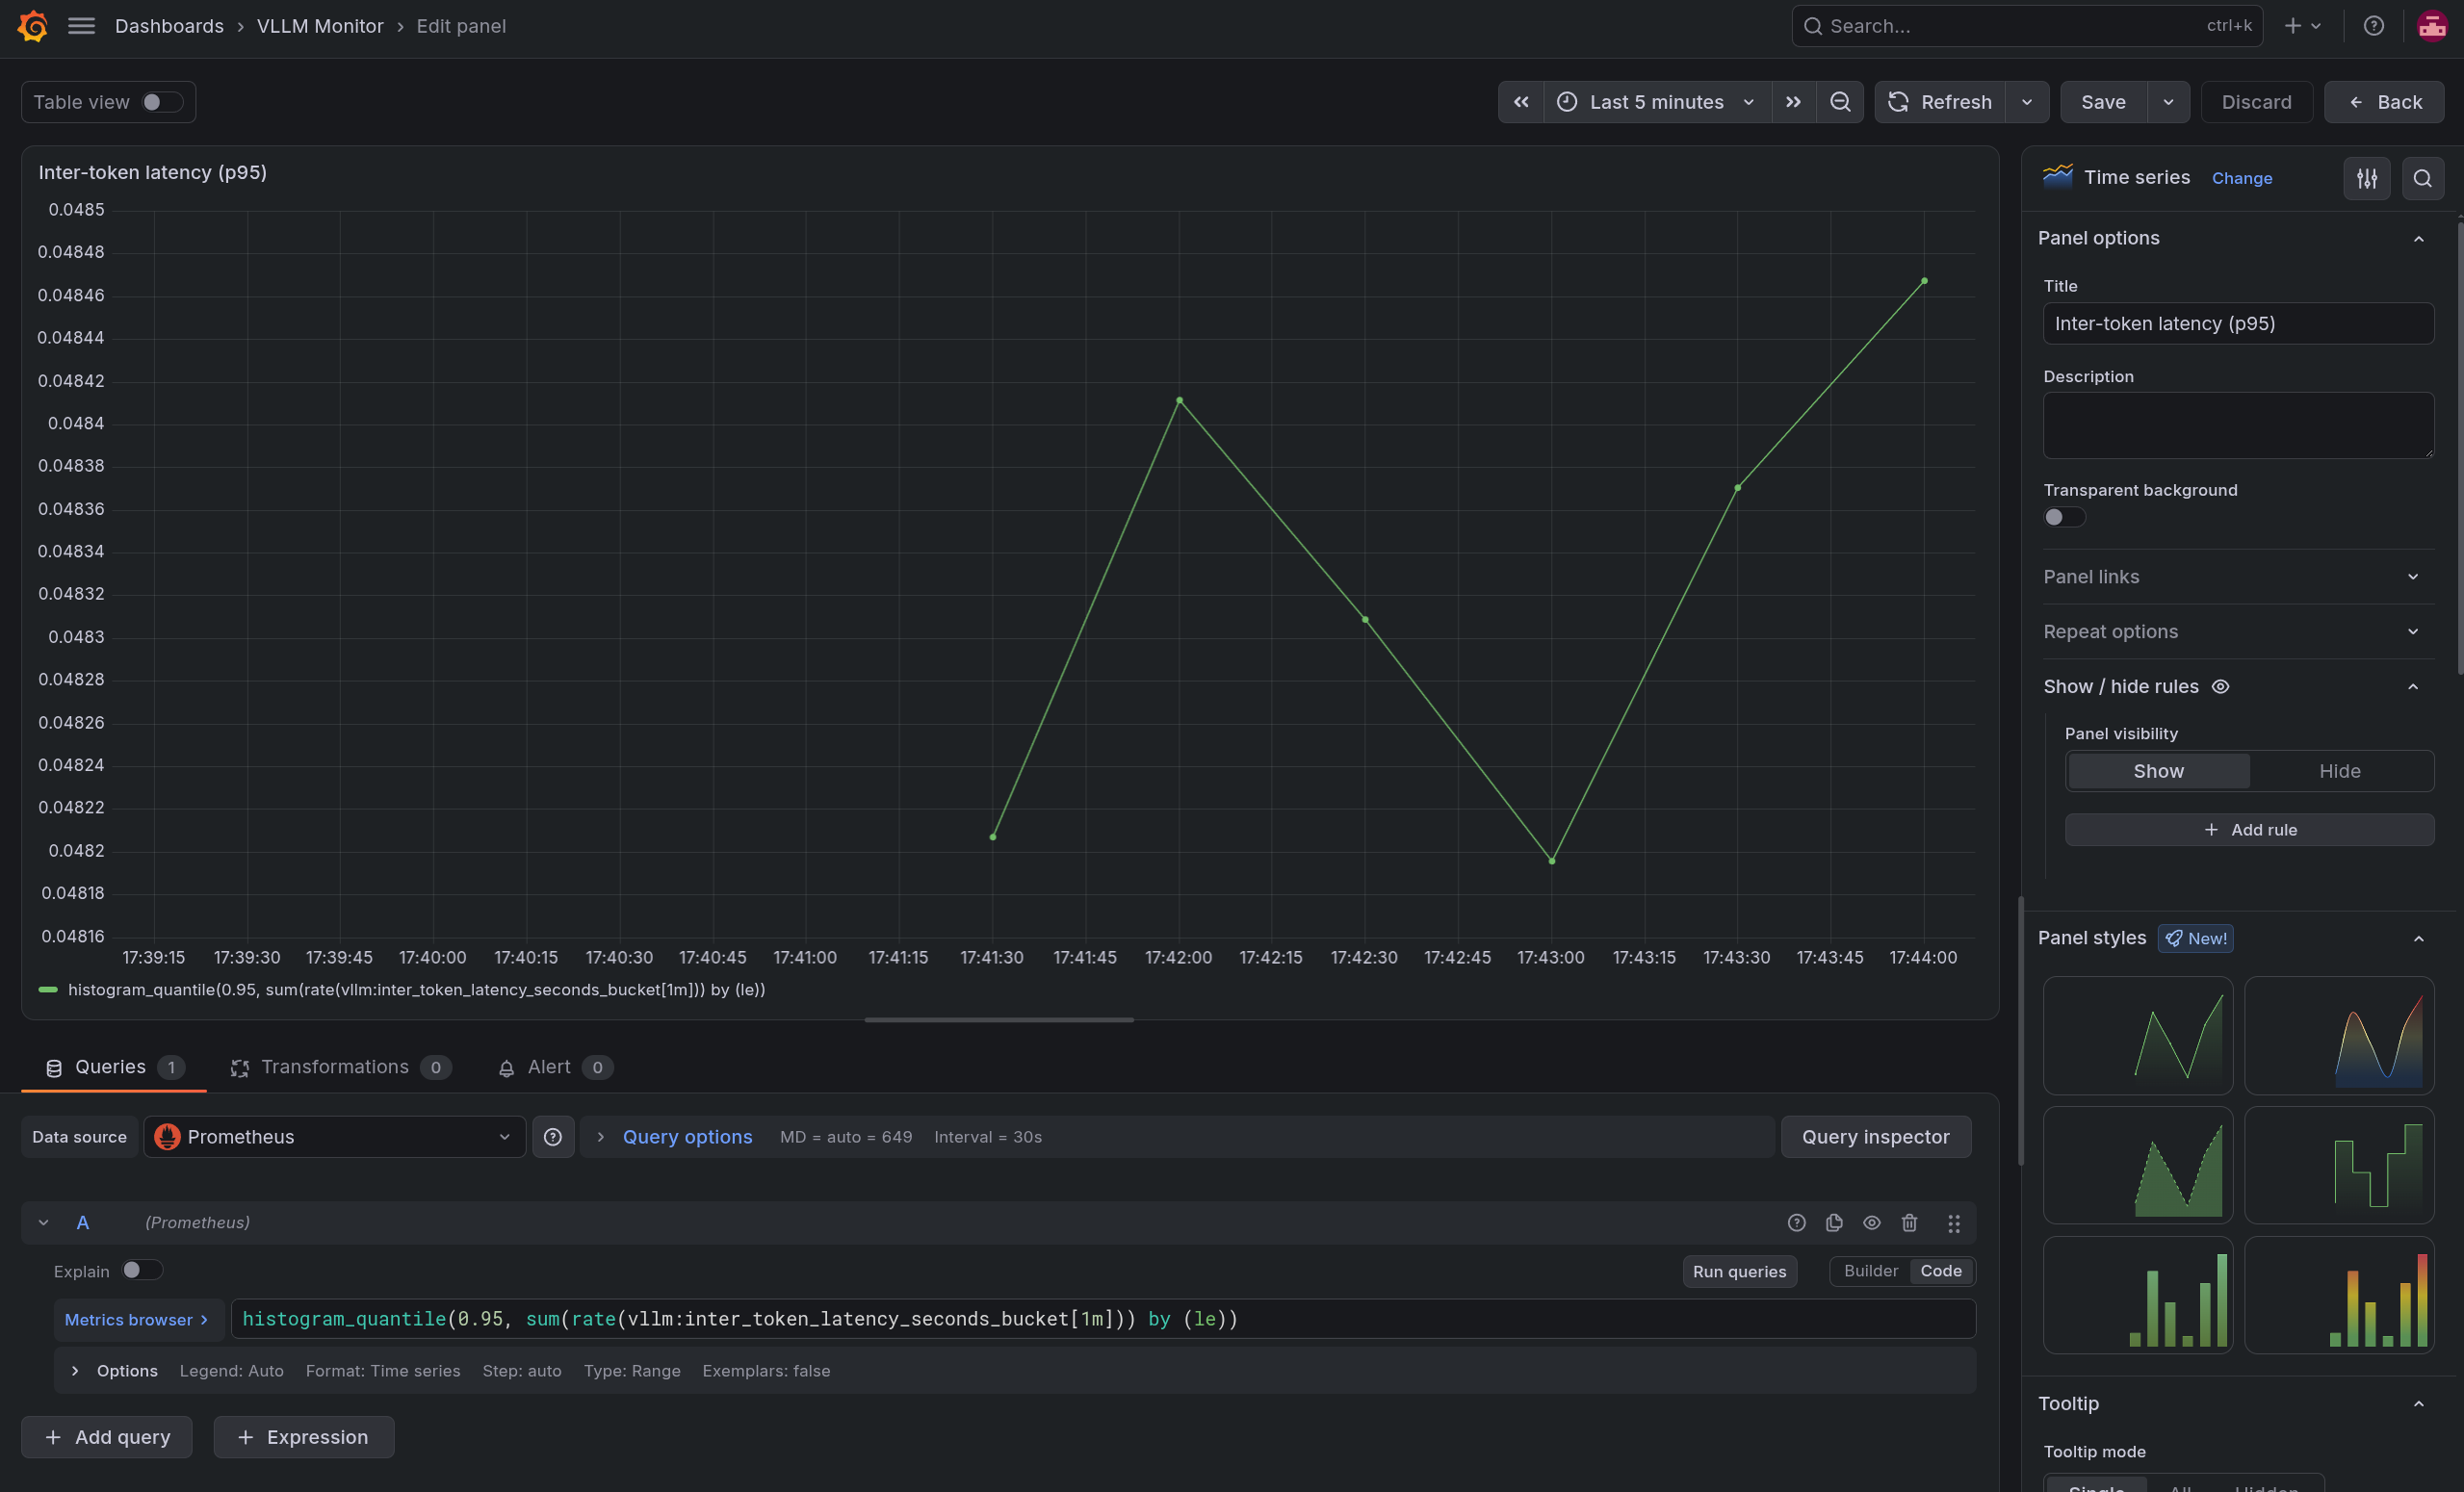
Inter-token latency (p95)#
These are the gaps in between each token after the first, which gives an indication of how “smooth” the stream reads.
histogram_quantile(0.95, sum(rate(vllm:inter_token_latency_seconds_bucket[1m])) by (le))
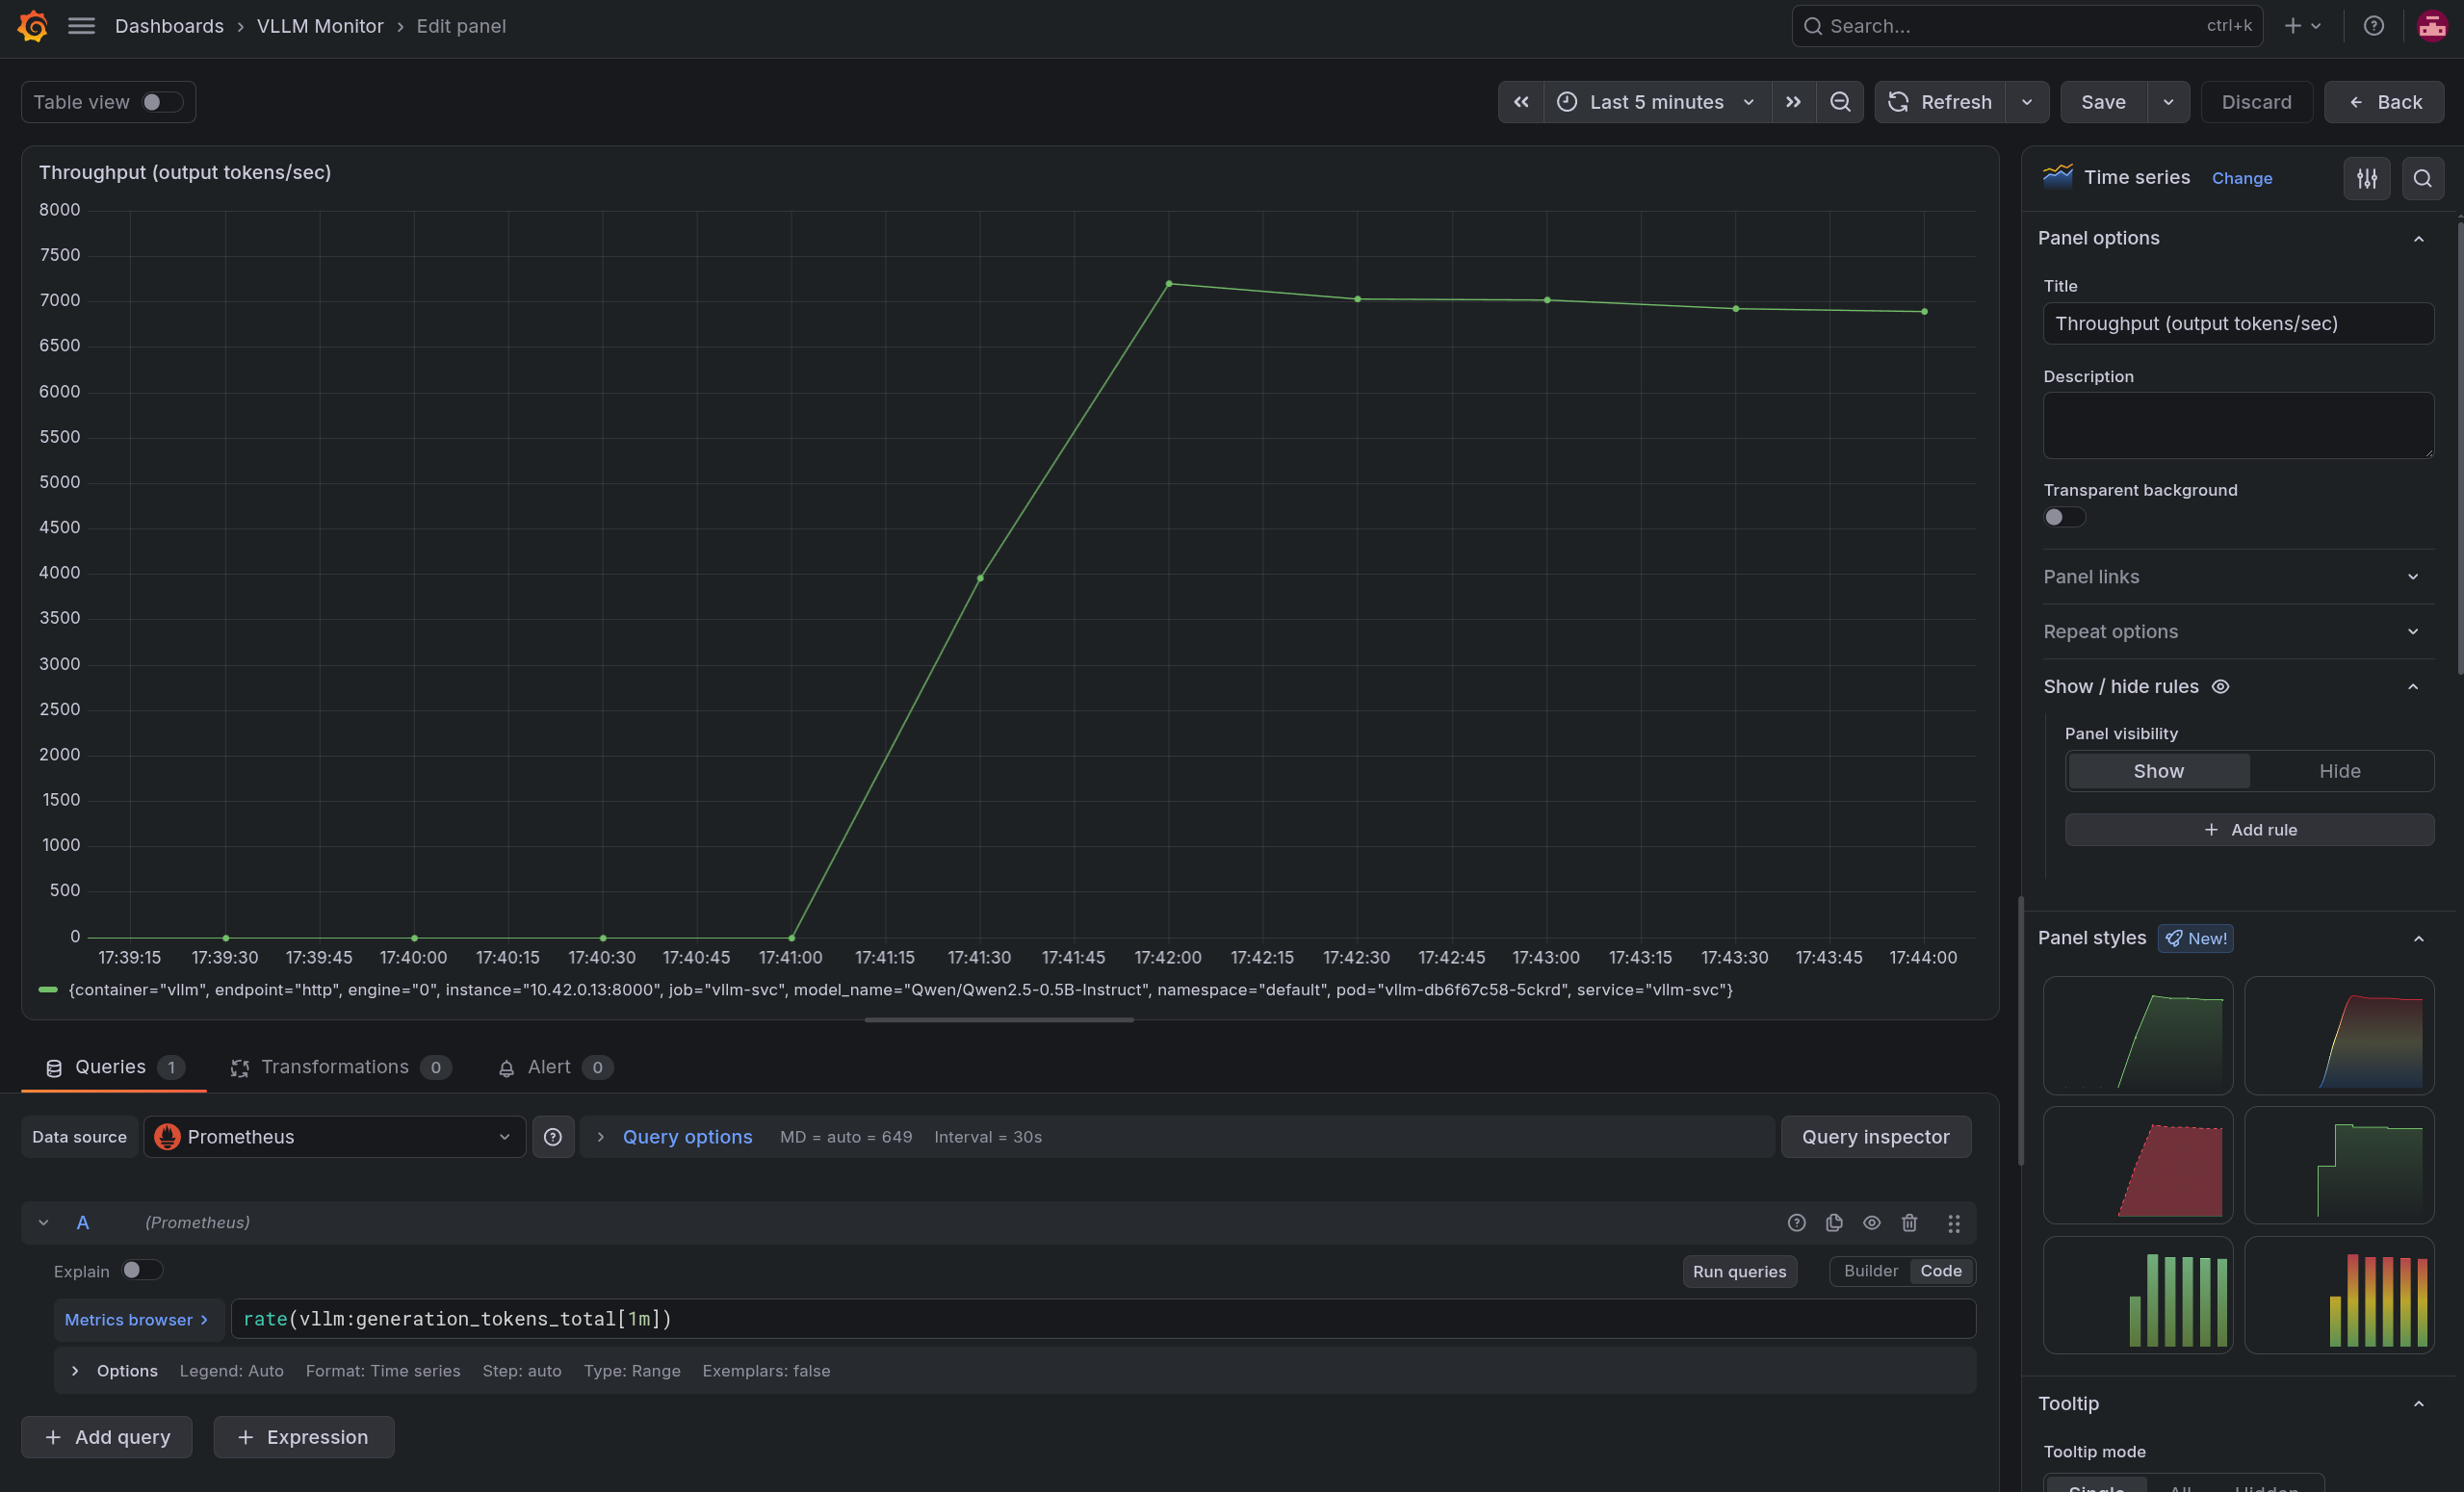
Throughput (output tokens/sec)#
This is how much work the GPU is actually doing.
rate(vllm:generation_tokens_total[1m])
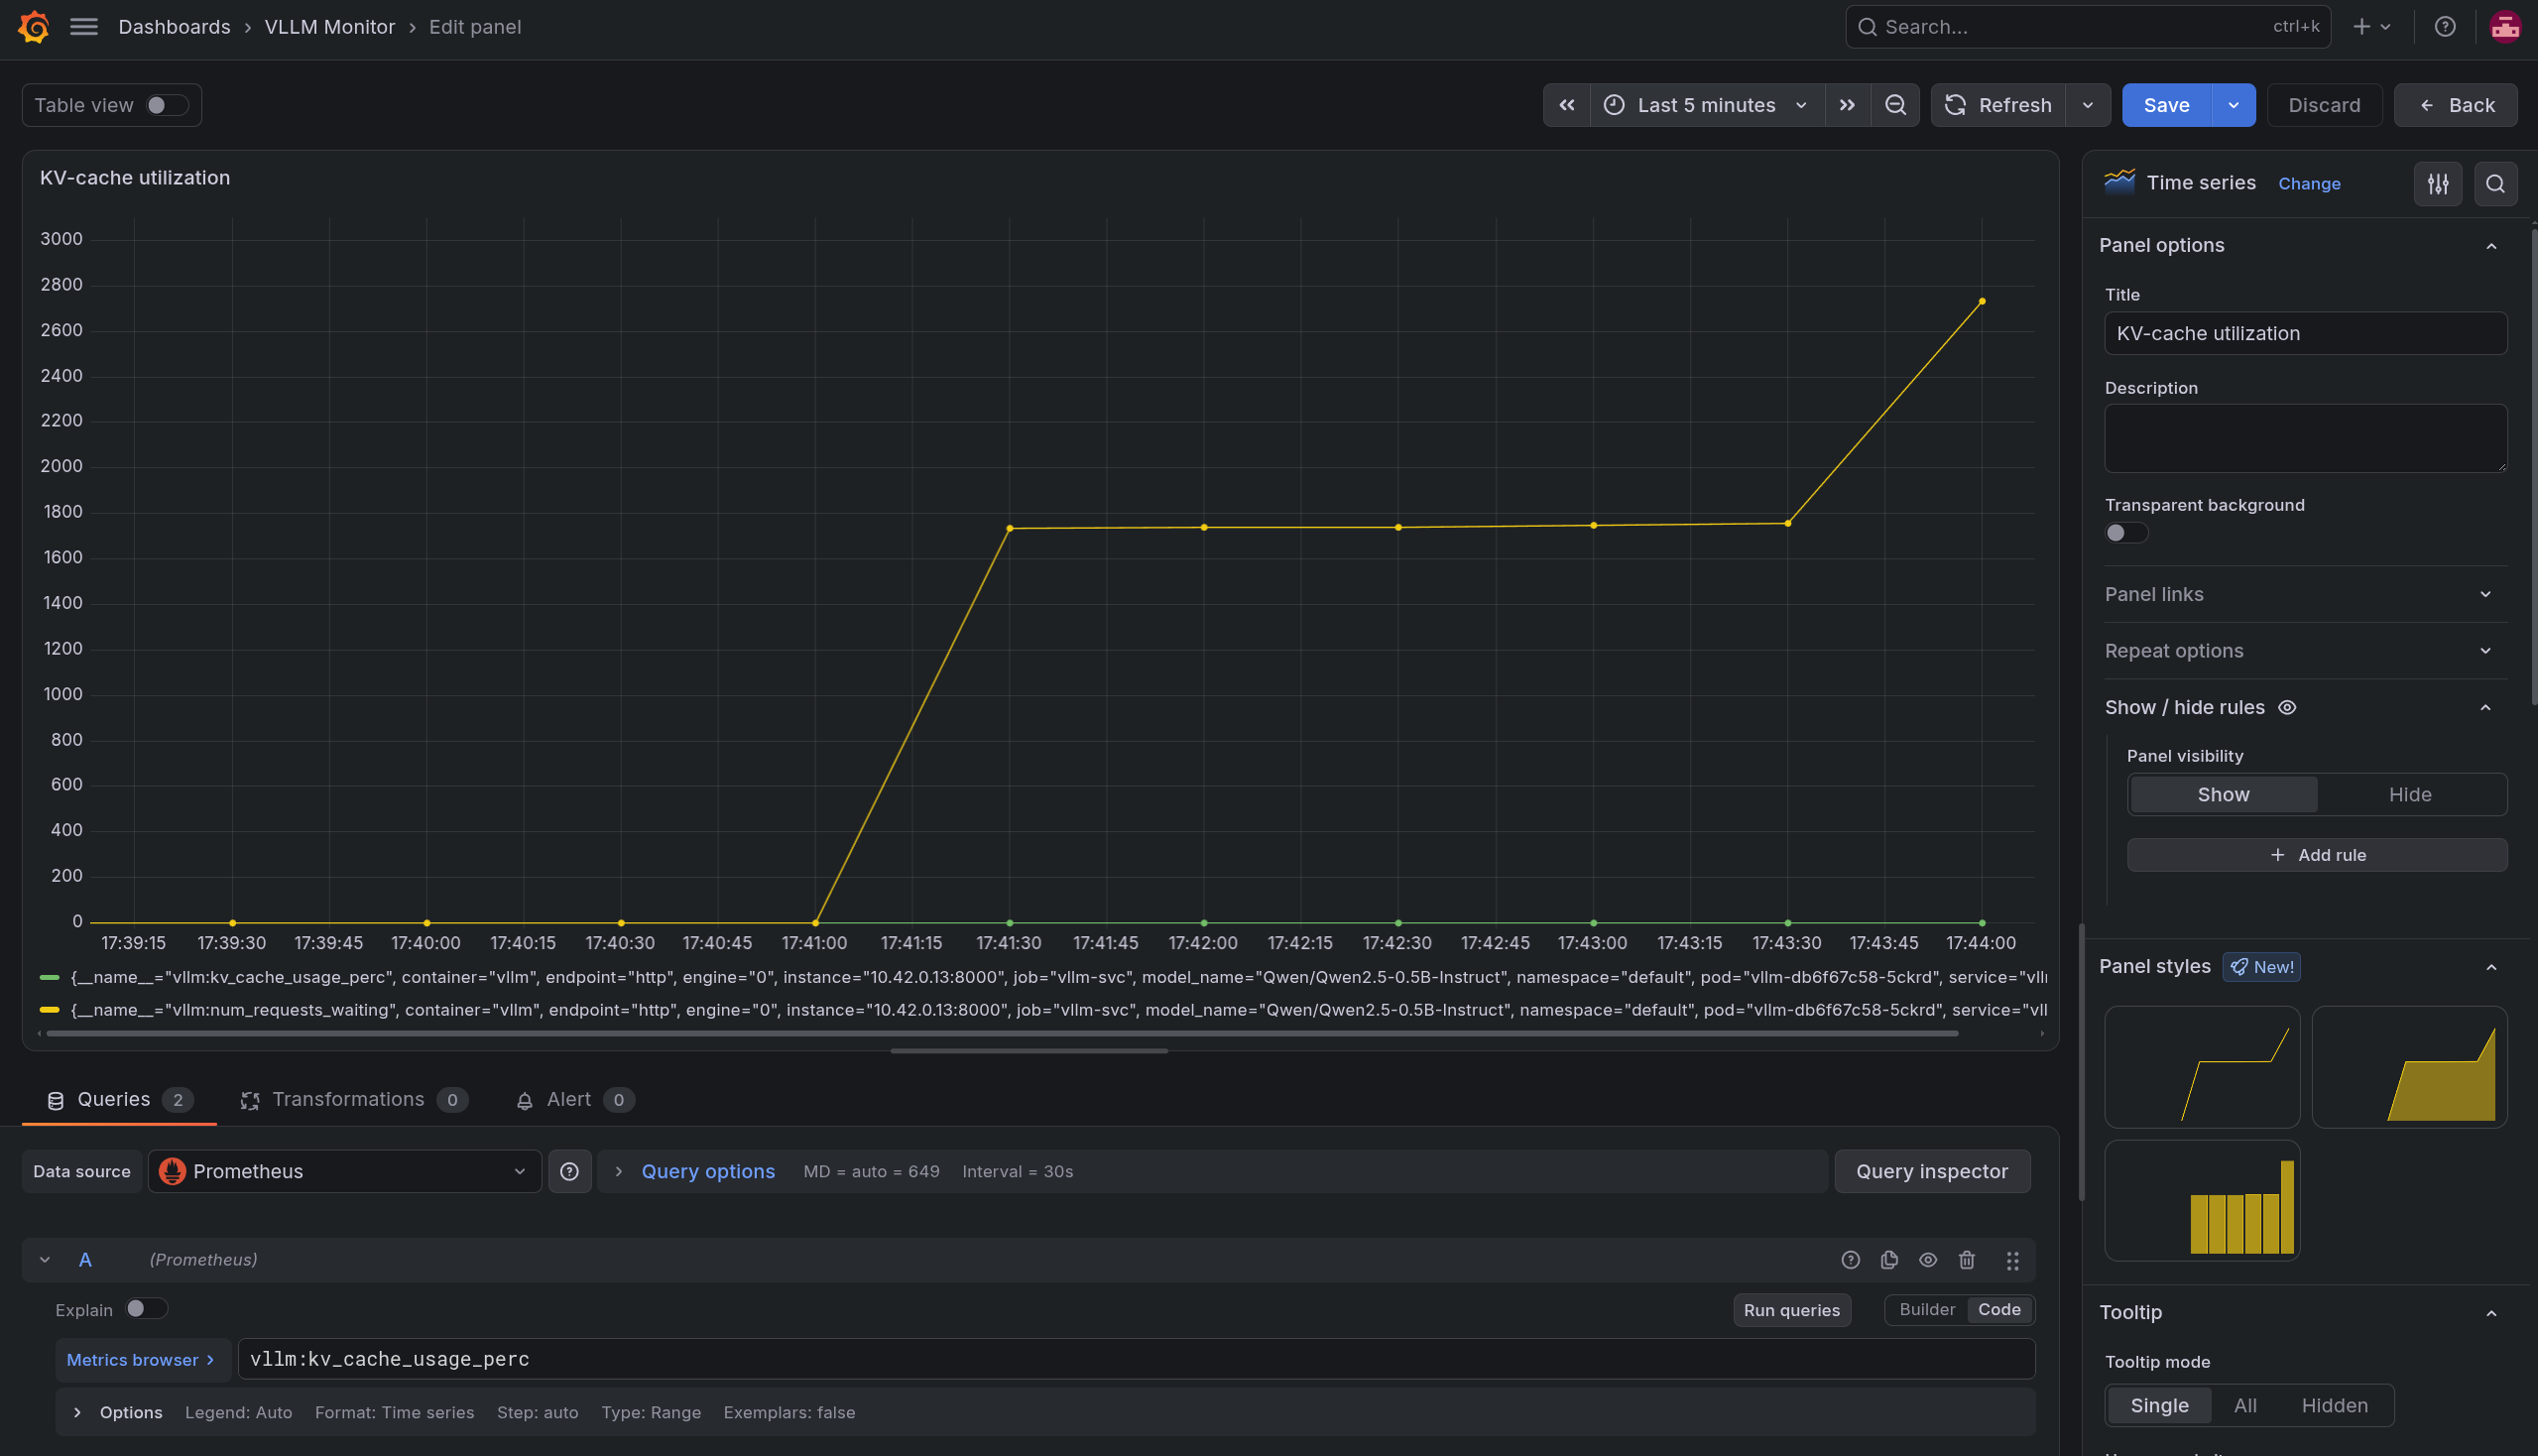
KV-cache utilization (percentage)#
Finally, the KV_cache utilization tells me how full the attention cache is.
vllm:kv_cache_usage_perc
There’s some stuff to understand here:
- Histograms (panels 1, 2) need histogram_quantile over
_bucket. A Prometheus histogram isn’t a single number; vLLM exports it as cumulative_bucketcounters, one per latency boundary (le = “less than or equal”). rate(…_bucket[1m]) gives the per-second increase of each bucket (the recent shape of the distribution), sum by (le) collapses any label splits into one set of buckets, and histogram_quantile(0.95, …) interpolates the 95th percentile from those bucket counts. - Throughput (panel 3) is a counter which is
rate().generation_tokens_totalonly ever climbs, so graphing it is a meaningless upwards ramp.rate(...[1m])converts it to tokens per second averaged over the trailing minute, so it measures throughput. This is why the_totalalways needs arate() - KV-cache is a gauage, so no
rate()at all. This is already instantaneous level.percentunitmakes Grafana show $0.85$ as85%. - The [1m] window means ~12 samples per rate calculation, since my scrape happens every 5 seconds (the
interval: 5sline in theServiceMonitor)
Bonus?#
Put panel 4 and vllm:num_requests_waiting on the same graph (by adding a second query to Panel 4):
vllm:num_requests_waiting
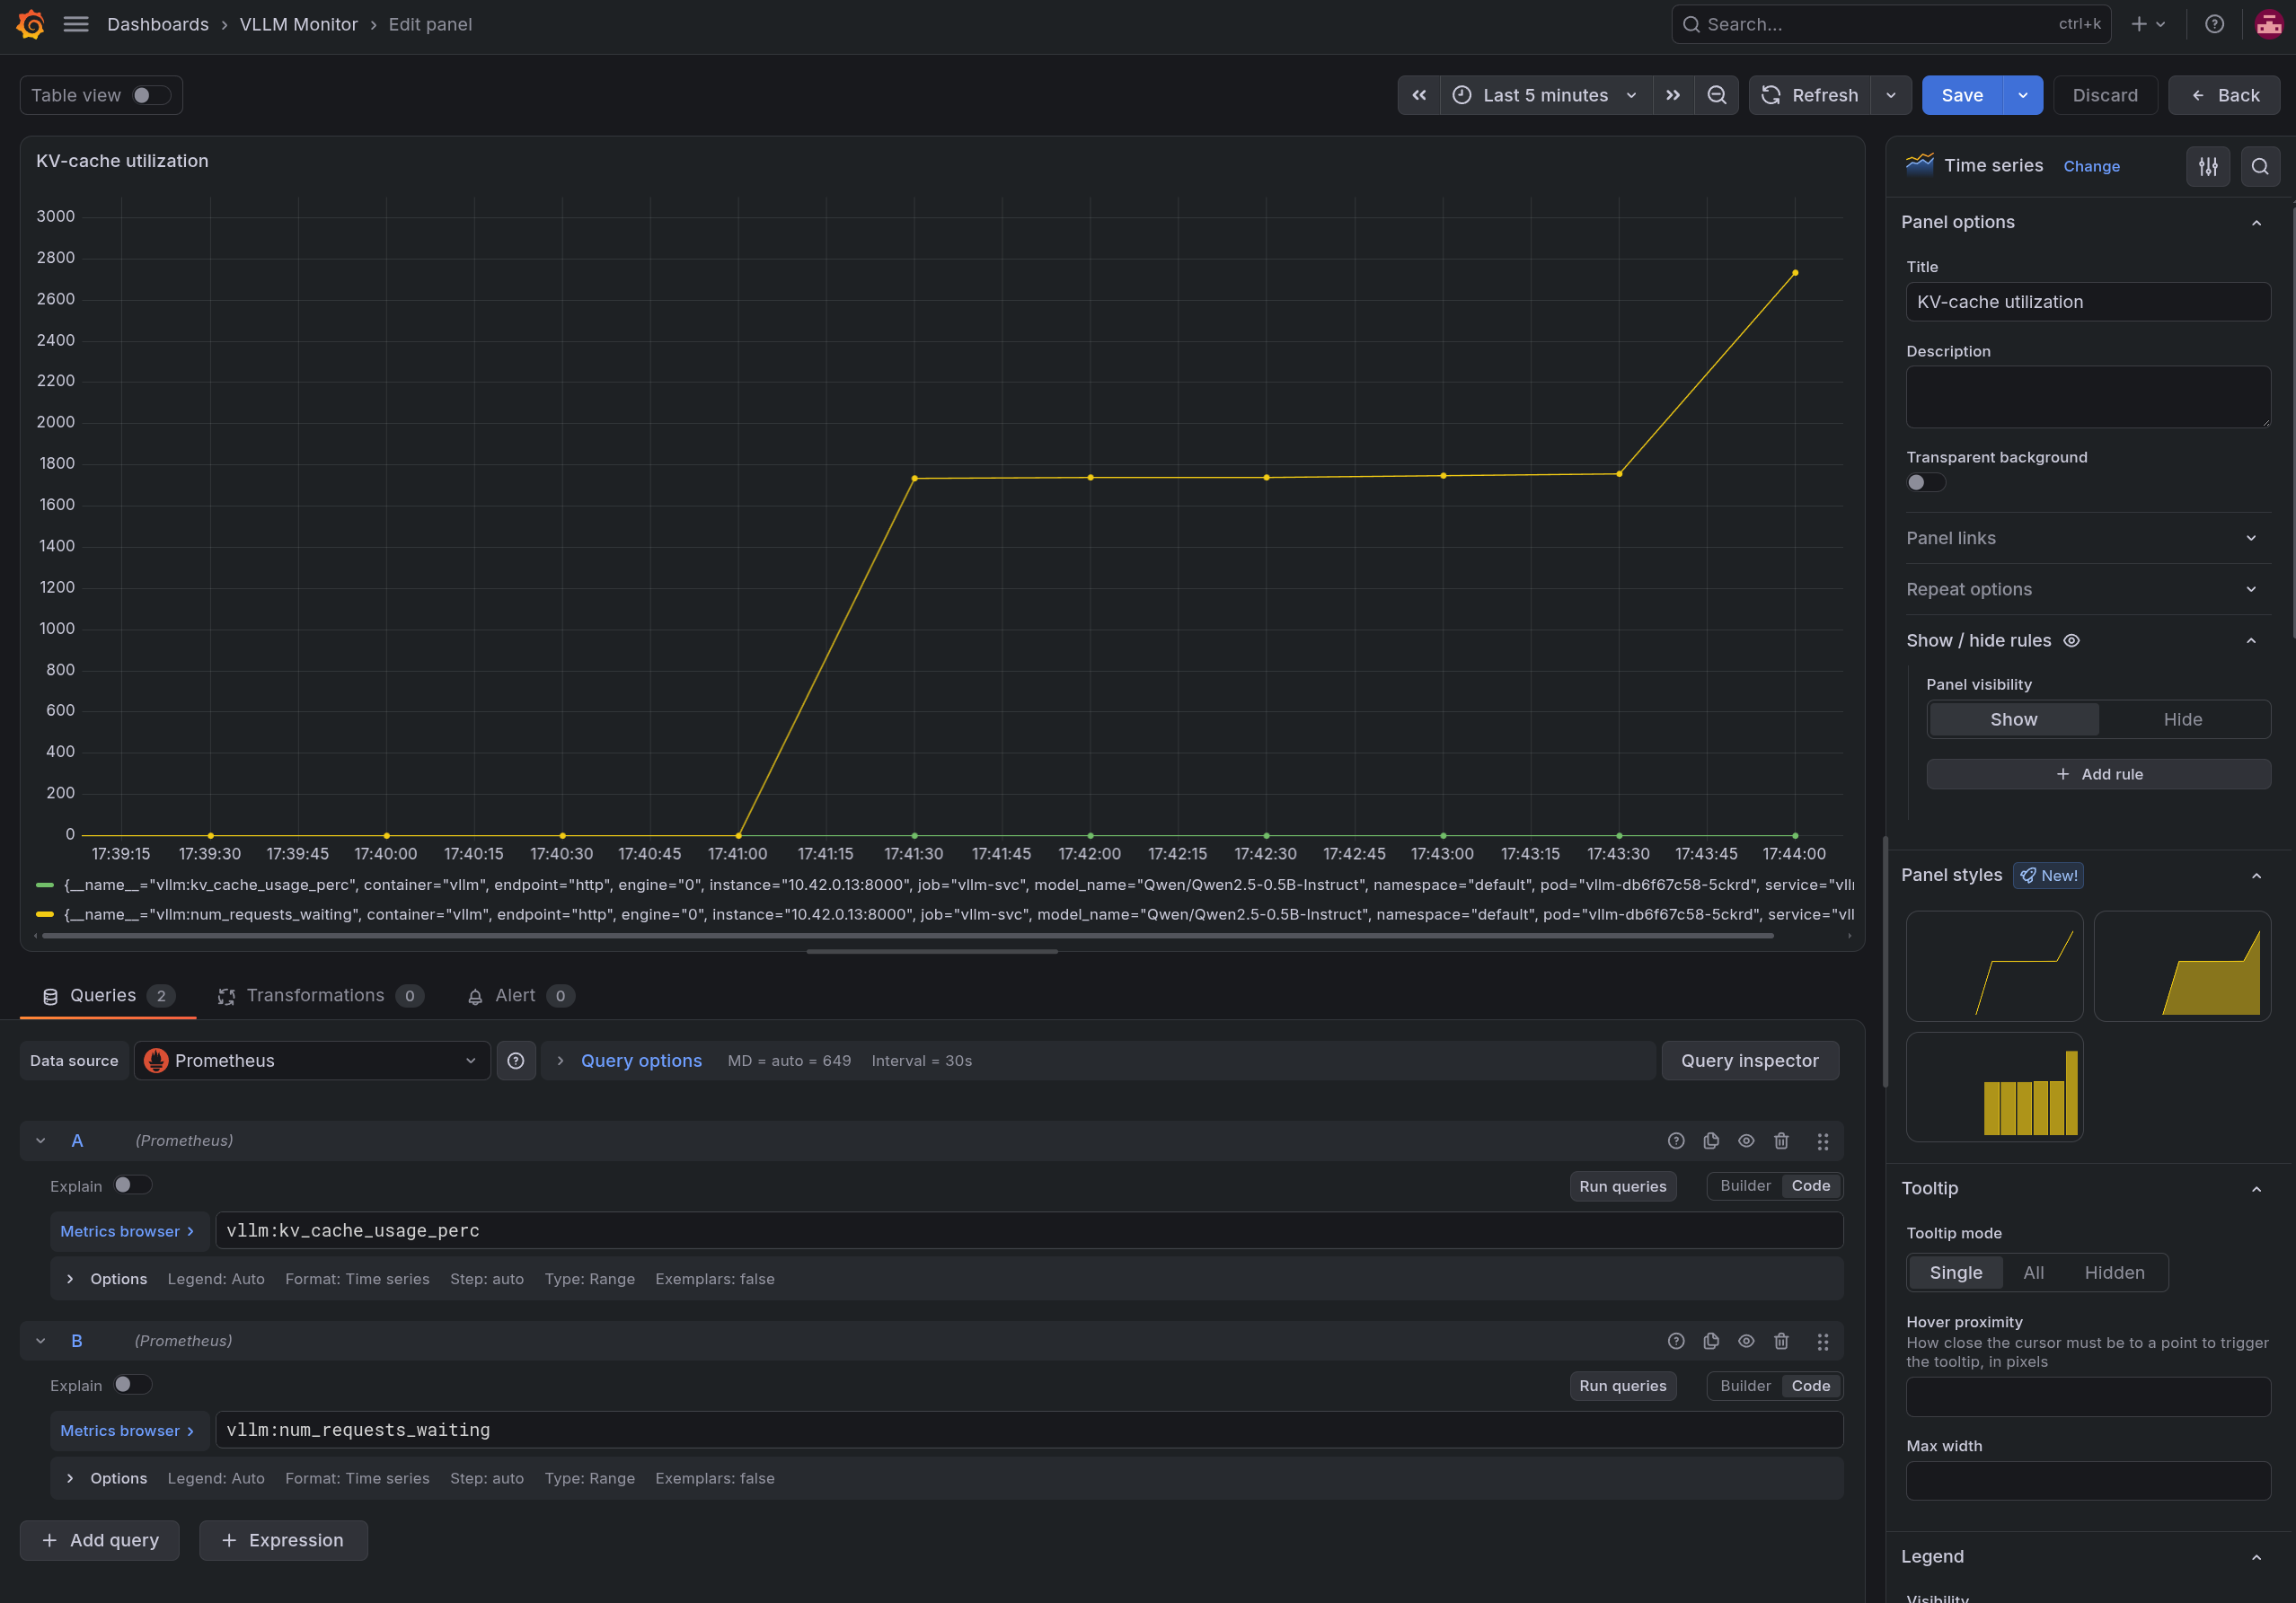 These two together are the paged-attention story visualized. As KV-cache usage climbs towards 1.0,
 num_requests_waiting lifts of zero, because once the cache blocks are allocated, new sequences can’t be admitted and have to queue instead. That correlation would show why my vLLM saturates, as opposed to just knowing that it does.
Testing with a bash loop#
Okay so we have vLLM and we have an empty dashboard, let’s create a very small loop to visualize what happens when we start hitting the endpoint:
for i in $(seq 1000); do # change the 1000 to whatever is reasonable for your system
  while true; do
    curl -s http://localhost:8000/v1/chat/completions \
      -H "Content-Type: application/json" \
      -d '{"model":"Qwen/Qwen2.5-0.5B-Instruct","messages":[{"role":"user","content":"Write a paragraph about the ocean."}]}' \
      >/dev/null
  done &
done
# stop with: kill $(jobs -p)